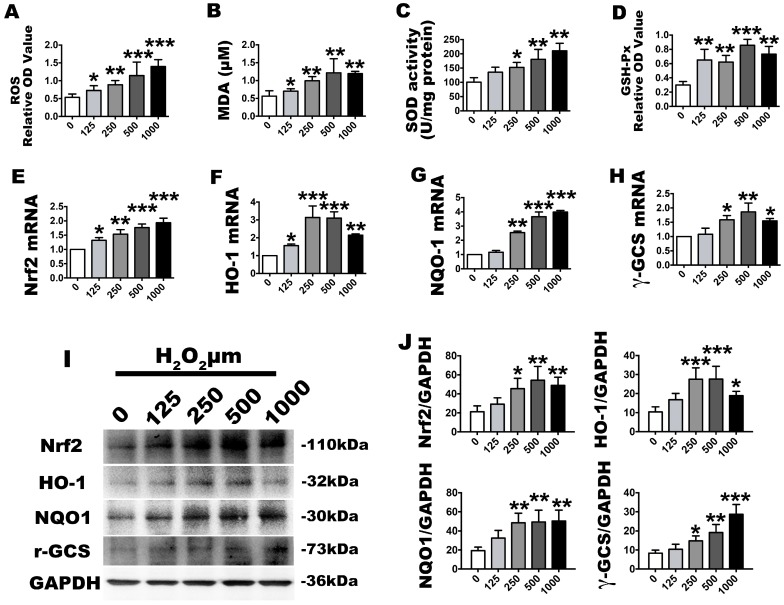
Figure 3.
Effects of the H2O2 treatment model, as described in the group design, on cell oxidative stress and anti-oxidative changes. The corresponding ROS level were assessed by (A) absorbance OD values, (B) MDA expression levels and (C) superoxide dismutase (SOD) and (D) GSH-Px absorbance OD values; (E–H) Relative Nrf2, HO-1, NQO1 and γ-GCS molecular gene expression levels, as determined by real-time PCR analysis; (I) Western blot images for nuclear factor-erythroid 2-related factor 2 (Nrf2), heme oxygenase-1 (HO-1), NAD(P)H:quinone oxidoreductase 1 (NQO1) and γ-glutamyl cysteine synthetase (γ-GCS) and (J) their quantification. Data are presented as the means ± SD, n = 5. Different H2O2 concentration treatments containing 125, 250, 500 and 1000 µmol/L were compared with a 0 µmol/L control group. * p < 0.05, ** p < 0.01 and *** p < 0.001 represent significant differences between the indicated columns.

