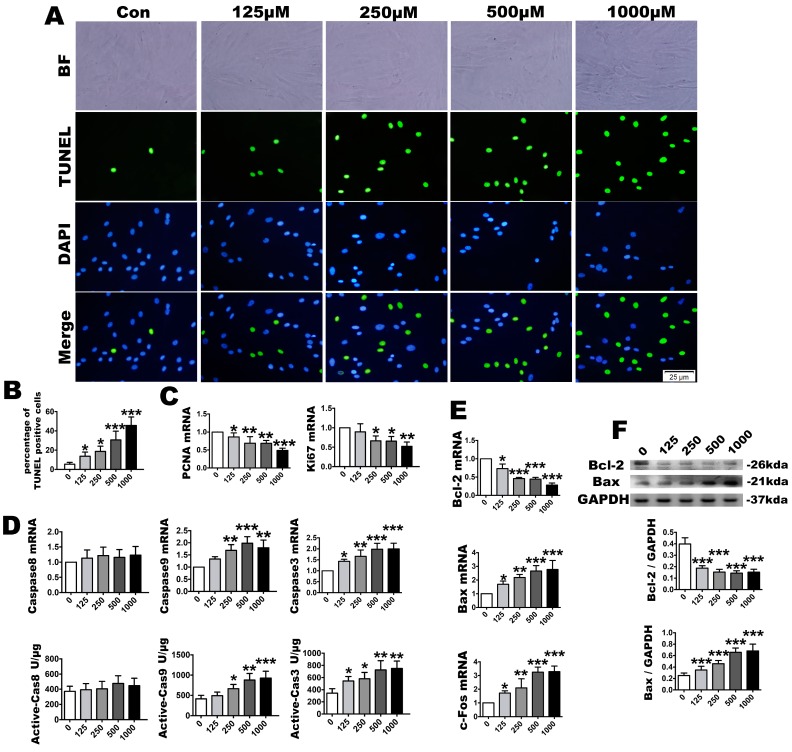
Figure 4.
After H2O2 treatment, identification of cell proliferation and apoptosis. Representative cell apoptosis images, as assayed by (A) TUNEL staining and (B) its quantification; The TUNEL staining were accompanied with a nuclear stain and morphological by DAPI and BF. BF means bright fields. DAPI means 4′,6-diamidino-2-phenylindole. Bars = 25 µm; (C) Relative proliferation parameters of PCNA and Ki67, as determined by real-time PCR analysis; (D) Caspase-8, caspase-9 and caspase-3 mRNA expression and active unit levels; Relative Bcl-2, Bax and c-Fos expression levels, as assayed by (E) real-time PCR and (F) Western blotting. Data are presented as the means ± SD, n = 5. Different H2O2 concentration treatments containing 125, 250, 500 and 1000 µmol/L compared with a 0 µmol/L control group. * p < 0.05, ** p < 0.01 and *** p < 0.001 represent significant differences between the indicated columns.

