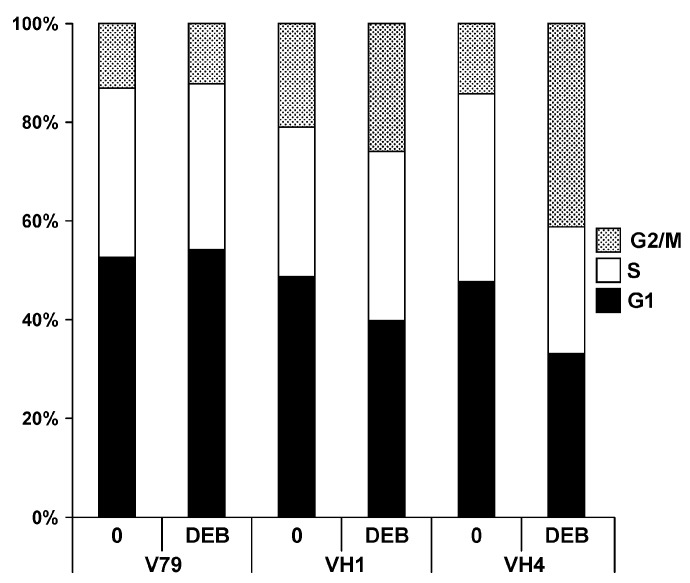
Figure 2.
Cell cycle distribution of V79, V-H1 and V-H4 cells prior to and 24 h post exposure to DEB. Cells incubated for three hours in the absence (0) or presence (15) of 15 µM DEB were subjected to flow cytometry as described in the Methods section. The image depicts the percentage of cells in the G1, S and G2/M phases of the cell cycle. Results represent the average of three separate experiments. DEB exposure significantly increased, or decreased, respectively, the percentage of V-H4 cells in G2/M and S phases of the cell cycle. p < 0.05, t-test with Bonferroni correction.

