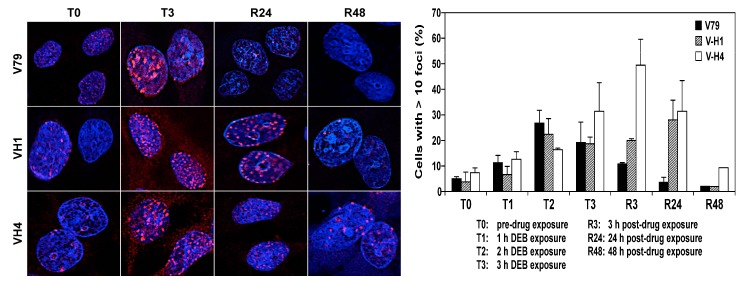
Figure 6.
Images (left) and dynamics (right) of phosphorylated histone H2AX-containing foci in V79, V-H1 and V-H4 cells prior to and following exposure to 15 µM DEB. Cells were exposed to 15 µM DEB for 3 h and subsequently DEB was removed and replaced with fresh growth media. At the indicated times, immunocytochemistry was performed using a rabbit polyclonal antibody specific for phospho-H2AX, as described in the Methods section. Time points are the same as Figure 3. The data represent the percentage of cells within randomly selected microscope fields that contained 10 or more foci, plus the standard error of the mean, n = 3. * p < 0.05.

