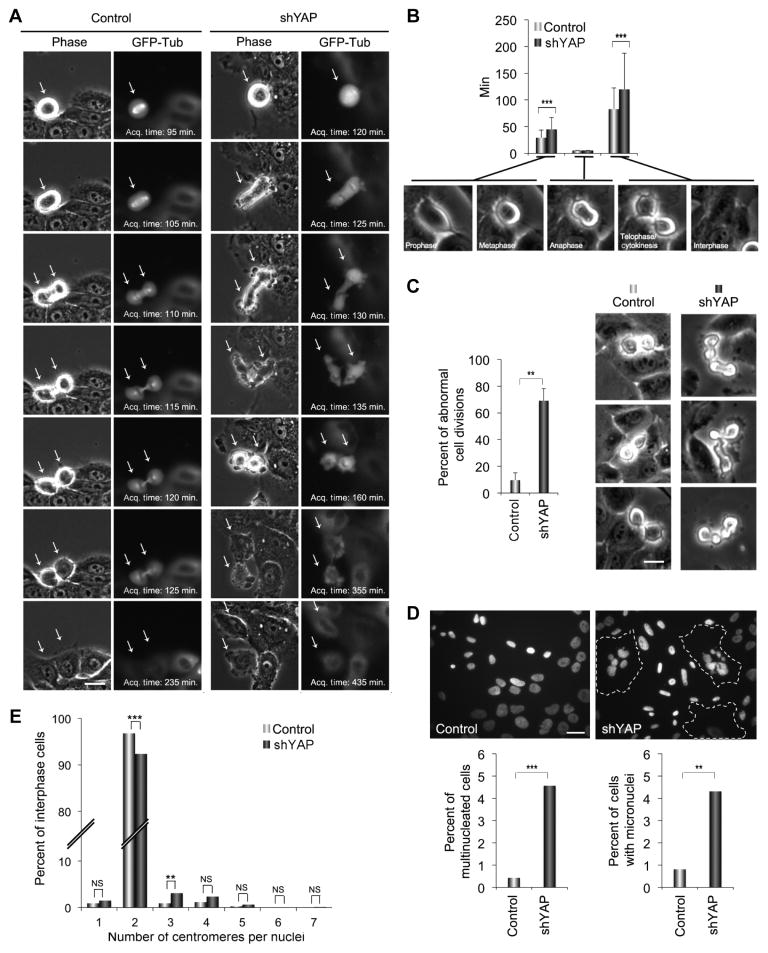
Fig. 2. Loss of YAP disrupts cytokinesis.
(A) Representative time-lapse images of mitosis of MCF-10A cells expressing GFP-tubulin (GFP-Tub) and infected with an empty lentiviral vector (control) or a vector encoding an shRNA targeting YAP (shYAP) during mitosis. Arrows indicate mitotic cells. shYAP cells show extensive blebbing and altered morphology during mitosis. Scale bar, 5 μm. Acq., acquisition. (B) Graph shows mean duration of mitosis (+SD) from three independent experiments for control (n = 127) and shYAP (n = 116) cells at the indicated division stages. The duration of anaphase was less than the time-lapse minimum interval for all cells. (C) Images show control and shYAP MCF-10A cells in cytokinesis. Graph shows percent of the cell divisions in control (n = 127) and shYAP-expressing (n = 116) cells with abnormal morphology, as represented in the images in (A). Scale bar, 5 μm. Bars are means + SEM from three independent experiments. (D) Top panels show representative images of cell nuclei (DAPI) in control and shYAP MCF-10A cells; dotted lines indicate multinucleated cells. Graphs show percent of multi-nucleate cells or cells with micronuclei pooled from two experiments for control (n = 676) and shYAP (n = 655) cells. Scale bar, 10 μm. (E) FISH analysis of control (n = 114) and siYAP-expressing (n = 129) MCF-10A cells. Graph depicts the number of centromeres per nucleus for the indicated cells pooled from two independent experiments. Statistical significance [***P < 001; **P < 0.01; *P < 0.05; NS (not significant), P > 0.05] was assessed by unpaired Student’s t test in (B) and (C) and by Fisher’s exact test in (D) and (E).

