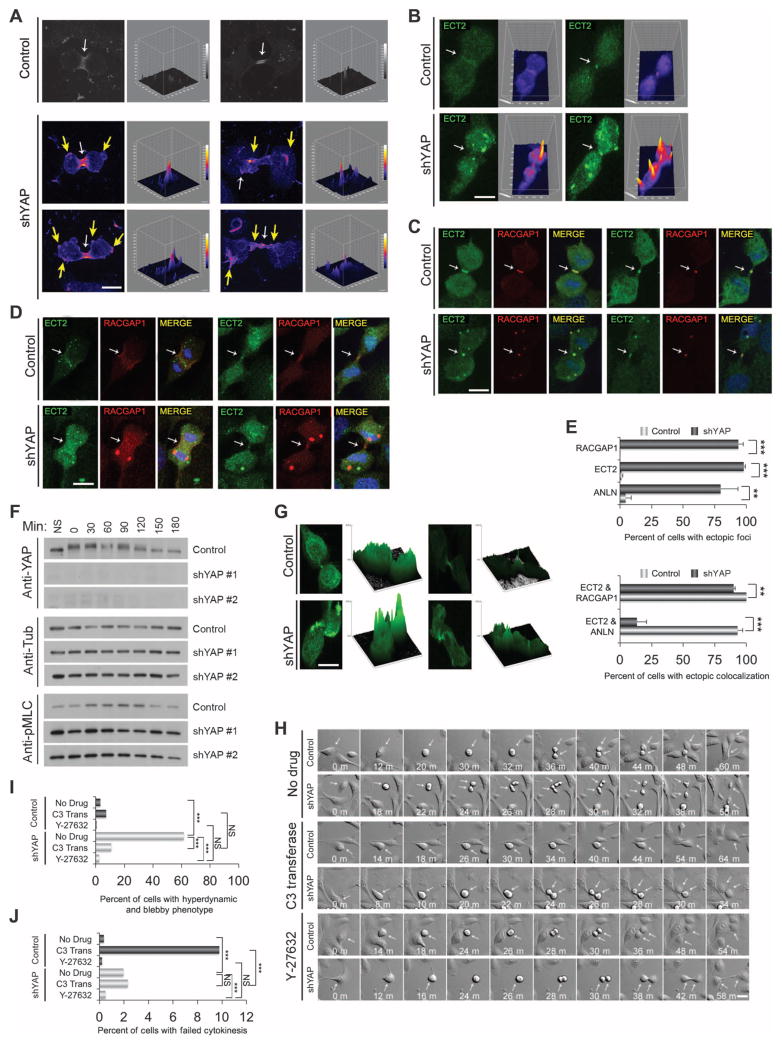
Fig. 3. YAP is required for proper cleavage furrow contractility.
(A) Representative examples of RHOA immunostains at early (left panels) and late (right panels) cytokinesis in control (n = 27) and shYAP (n = 33) MCF-10A cells. Cells were monitored on gridded coverslips to identify cells undergoing cytokinesis and were immunostained for RHOA (red). Surface intensity plots are shown to the right of each image to visualize the positions of RHOA. White arrows indicate normal RHOA staining, and yellow arrows indicate abnormal RHO Aectopicfoci. Scale bar, 5 μm. Images were obtained from three independent experiments. (B) Representative images of ECT2 localization (green) during cytokinesis incontrol (n = 119) or shYAP (n = 127)MCF-10A cells. Corresponding surface plots of ECT2 staining intensity. Scale bar, 5 μm. Images were obtained from three independent experiments. (C) Colocalization (merge) of ECT2 (green) and RACGAP1 (red) for control (n = 46) or shYAP (n = 41) MCF10A cells. Scale bar, 5 μm. Images were obtained from three independent experiments.(D)Colocalization(merge) of ECT2 (green) and ANLN (red) for control(n =23) or shYAP (n = 27) MCF10A cells. Scale bar, 5 μm. Images were obtained from four independent experiments. (E) Quantification of the percent of cells with mislocalized foci for ECT2, RACGAP1, and ANLN and quantification of the percent of cells showing ectopic colocalization between RACGAP1 and ECT2 or ANLN and ECT2. RACGAP1 and ECT2 ectopic foci colocalized but ANLN and ECT2 foci did not. Statistical significance (***P<001;**P<0.01;*P<0.05;NS,P>0.05) was assessed by unpaired Student’s t test. Bars represent means + SEM from three independent experiments. (F) Lysates from HeLa cells expressing control plasmid or two different shYAP hairpins (#1 or #2) were immunoblotted for phosphorylated MLC (pMLC), YAP, and tubulin, at the indicated times after nocodazole release. Immunoblots are representative of two independent experiments. (G) Representative images from control (n = 40) and YAP knockdown (n = 26) cells were obtained from three independent experiments showing phosphorylated MLC immunostaining in cytokinesis. Surface intensity plots are shown to the right of each immunostaining image to visualize the intensity of phosphorylated MLC throughout the cell. Scale bar, 5 μm. (H) Representative time-lapse images of control or shYAP MCF-10A cells undergoing cell division. Analysis was obtained from YAP knockdown cells treated with no drug (n = 747), the Rho inhibitor C3 transferase (n = 973), or the ROCK inhibitor Y-27632 (n = 729) and LKO control cells (Control) treated with no drug (n = 983), C3 transferase Rho inhibitor (n = 514), or Y-27632 ROCK inhibitor (n=870). Arrows indicate mitotic cells. Scale bar, 10 μm.(I) Quantification of YAP-depleted mitotic cells that display the hyperdynamic cell division phenotype, which consists of considerable blebbing and bulging. C3 Trans, C3 transferase. (J) Quantification of failed division for the indicated treatments. Data in (I) and (J) were pooled from two independent experiments and assessed for statistical significance (***P < 001; **P < 0.01; *P < 0.05; NS, P > 0.05) with Fisher’s exact test.

