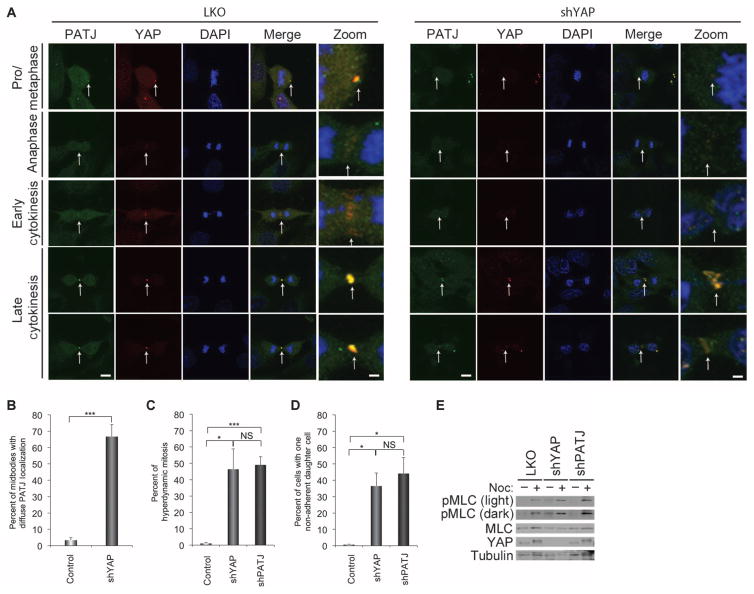
Fig. 6. Interaction of PATJ and YAP in mitotic cells.
(A) Representative immunostaining images of the localization of endogenous PATJ (green) and YAP (red) to the midbody in mitotic cells. Zoom shows magnification of colocalized areas of the midzone and midbody. Loss of YAP results in diffuse immunostaining of PATJ in the cleavage and midbody region. Scale bars, 1 μm in zoomed images and 5 μm in all others. Representative images from 60 control cells and 50 shYAP cells. (B) Quantitation of the number of cells with diffuse immunostaining of PATJ in the cleavage and midbody region. (C and D) Quantification of cells with the hyperdynamic phenotype (D) or with the nonadherent daughter cell phenotype (D) in cells expressing shPATJ (n = 232), shYAP (n = 277), or control LKO (n = 2206). Bars in (B), (C), and (D) represent means + SEM of three experiments each performed in triplicate. Statistical significance (***P < 001; **P < 0.01; *P < 0.05; NS, P > 0.05) was assessed by unpaired Student’s t test compared to control LKO. (E) Contractile activity for these conditions was also analyzed by immunoblot of phosphorylated MLC activity. MLC and tubulin were used as internal loading controls. Immunoblots are representative of three independent experiments.

