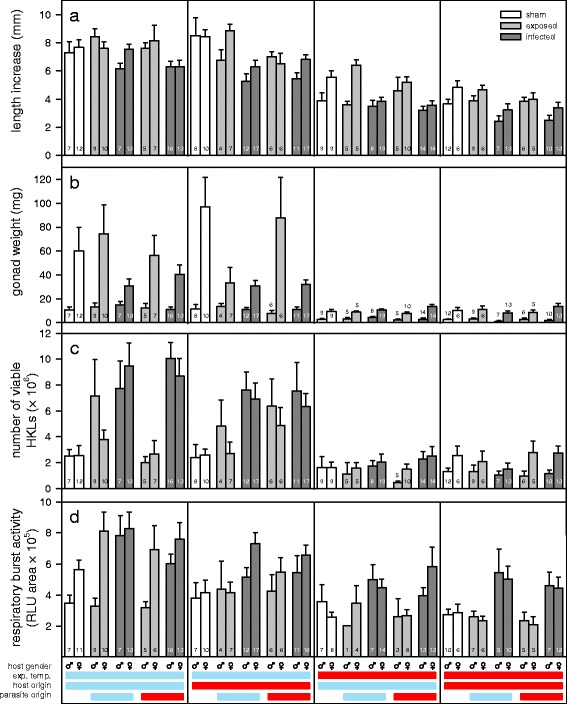
Fig. 1.

Host responses to temperature variation and S. solidus infection. a Host length increase. b Gonad weight. c Total number of viable head-kidney leukocytes (HKLs) per fish. d Respiratory burst activity. The cold experimental temperature (13 °C) and the cold host and parasite origin are indicated by the blue bars and the warm experimental temperature (24 °C) and the warm host and parasite origin by the red bars. Sample sizes are shown inside the bars and bars represent means ± SE from sham-exposed (sham), exposed but not infected (exposed) and infected sticklebacks
