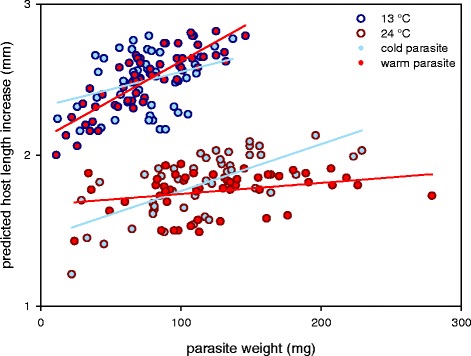
Fig. 5.

Host health tolerance. The interaction between experimental temperature (13 or 24 °C), parasite origin (cold or warm) and parasite weight (F (1,177) = 6.72, P = 0.010), indicates variation in health tolerance. Steeper positive slopes of the linear relationship between host length increase and parasite weight indicate greater health tolerance. Values for host length increase are model predictions from Box-Cox transformed data and not congruent with the values from Fig. 1a
