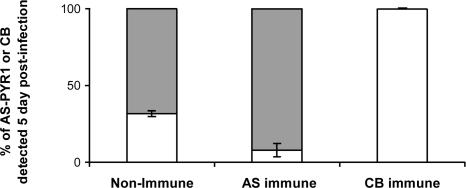
Fig. 1.
The proportion of parasites carrying the AS-PYR1 or CB allele of P. c. chabaudi msp1 measured by RTQ-PCR analysis of DNA samples obtained from mixed-strain infections in two nonimmune mice, two AS-PYR1-immune mice, and two CB-immune mice at 5 days after inoculation. The DNA concentrations of each msp1 allele (AS-PYR1 or CB) as measured by RTQ-PCR, are given as a ratio to show their relative proportions in each sample analyzed. The bars represent the SD of AS-PYR1 and CB measurements between mice. Gray bars represent the proportions of CB parasites in a mixture, and white bars represent the proportions of AS-PYR1 parasites in a mixture.

