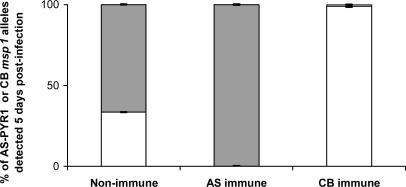
Fig. 4.
The relative proportions of AS-PYR1 and CB alleles of msp1 measured by RTQ-PCR in the progeny of the genetic cross between AS-PYR1- and CB-cloned strains of P. c. chabaudi. Data represent the mean values and SE obtained from five independent measurements of AS-PYR1 or CB allelic variants of msp1. Gray bars represent the proportions of parasites carrying the CB allele of msp1, and white bars represent the proportions of parasites carrying the AS-PYR1 allele of msp1.

