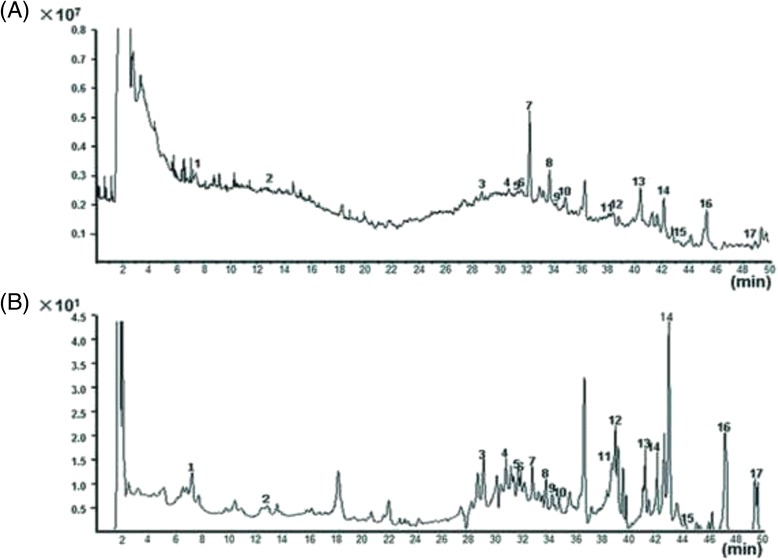
Fig. 2.

TIC chromatogram and VU chromatogram of the extract of DHFZT in negative ion mode. (a) total ion current chromatogram, X-axis represents the retention time (min), Y-axis represents ion intensity; (b) ultraviolet chromatogram, X-axis represents the retention time, Y-axis represents mAU. TIC total ion current, VU ultraviolet
