Figure 5. .

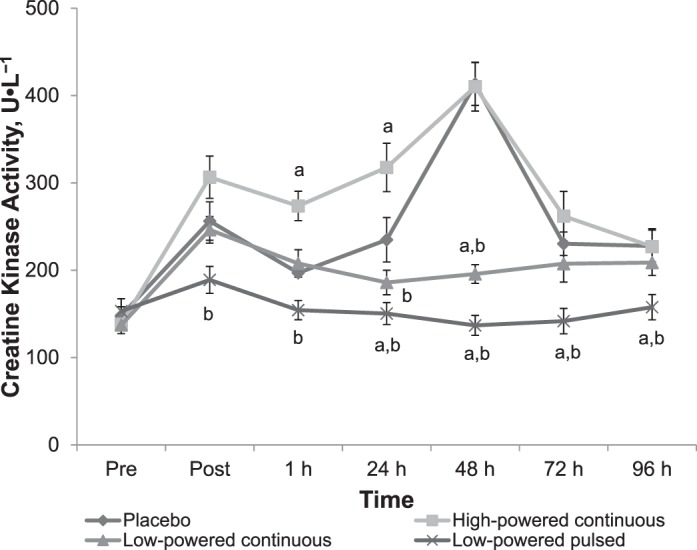
Creatine kinase activity. Values are means and error bars are standard errors of the mean. a Indicates difference compared with placebo (P < .05). b Indicates difference compared with high-powered continuous laser/light group (P < .05).

Creatine kinase activity. Values are means and error bars are standard errors of the mean. a Indicates difference compared with placebo (P < .05). b Indicates difference compared with high-powered continuous laser/light group (P < .05).