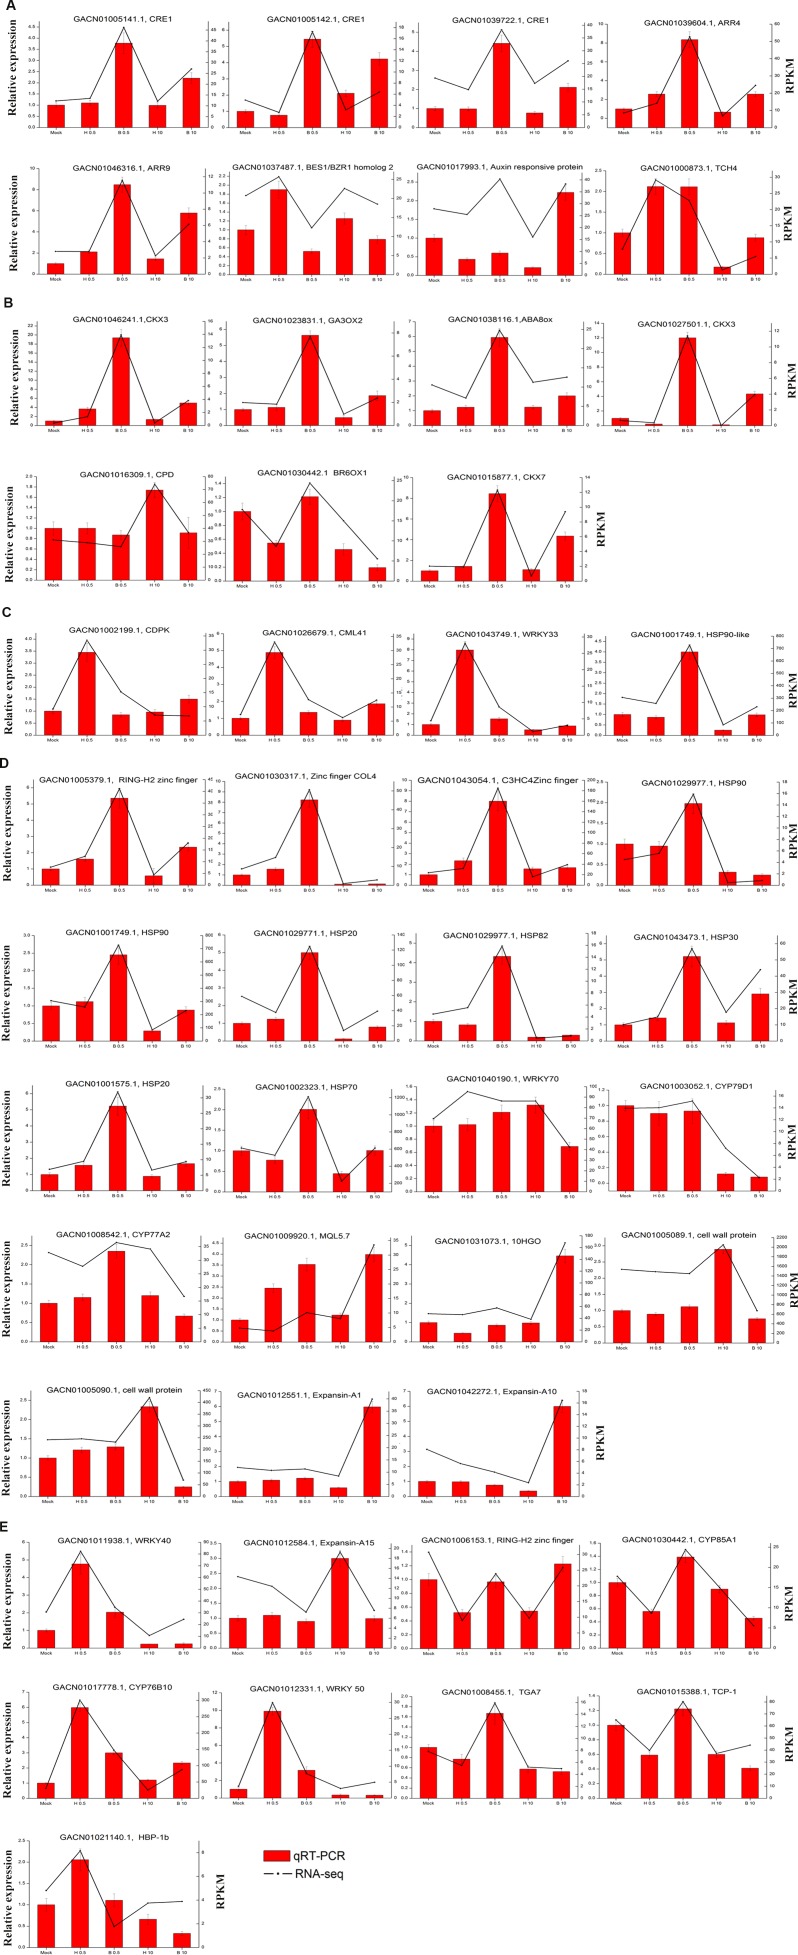
Figure 6. Comparison of unigene expression levels revealed by qRT-PCR and RNA-seq (RPKM).
(A) DEGs involved in “Plant hormone signal transduction”. (B) DEGs involved in “hormone biosynthesis”. (C) Four DEGs involved in “plant-pathogen interaction”. (D) DEGs selected from the four classes (nine in Class II, six in Class III and four in Class IV) (E) Nine DEGs selected randomly. ACTIN (AJ763915) of G. hybrida was used as the normalization control. Three biological repeats were included for each condition.

