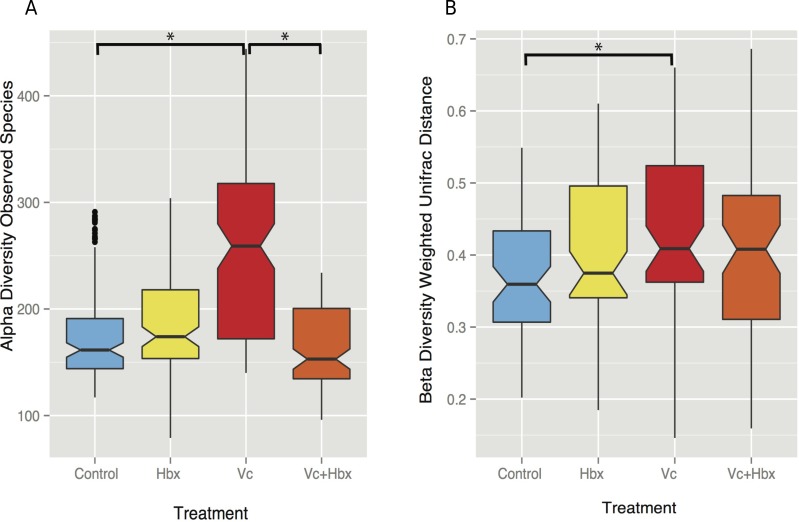
Figure 3. Impact of bacterial challenge on coral associated microbial diversity.
(A) Mean alpha diversity (observed species) plotted for each treatment, and (B) mean beta diversity (Weighted UniFrac distance) by treatment. The asterisks indicate Bonferroni-corrected p values <0.05 for the nonparametric t-test between treatments. In both cases while addition of the pathogen alone increased diversity, predator addition counteracted this effect.

