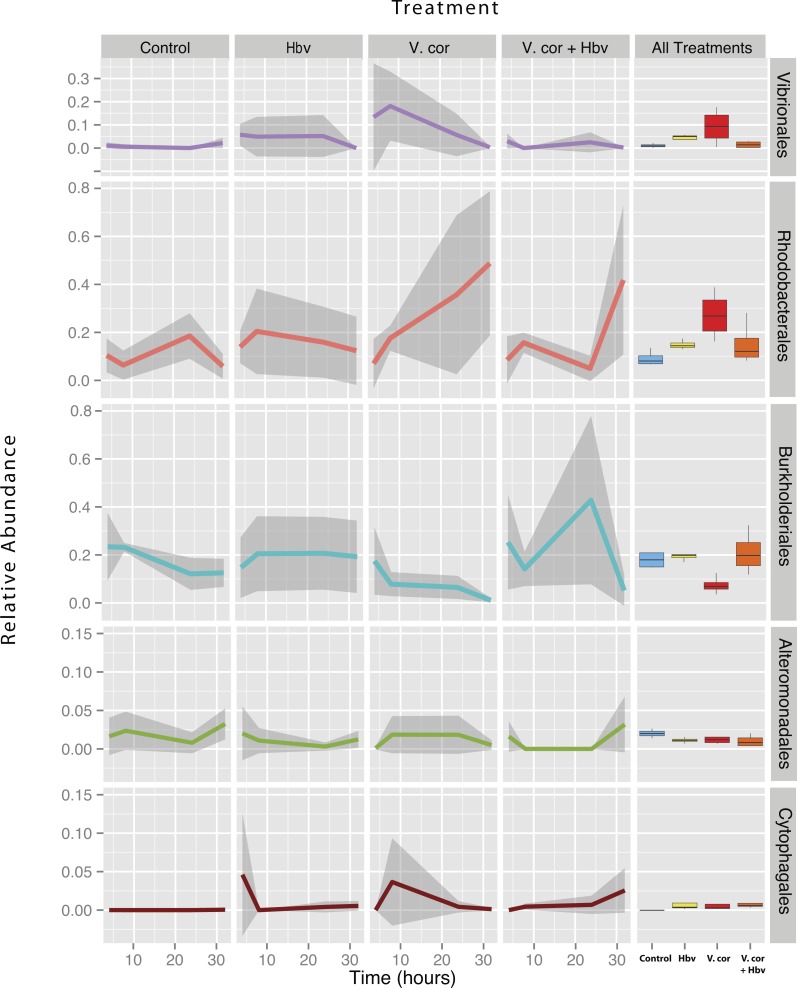
Figure 4. Relative abundance of all taxa found to be differentially present under the four bacterial challenges.
Colored lines denote mean relative abundance for each time point with grey transparent shading indicating the standard deviation. Boxplots show the mean relative abundance averaged across all time points for each treatment.

