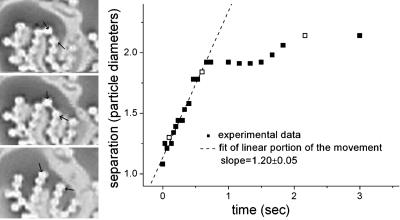
Fig. 5.
Two particles separate from one another to break an artificial loop. (Left) Three snapshots of two particles (indicated by the two arrows in each photo), which were artificially placed in a loop (Top). After less than a second the two particles separate from one another (Middle). At that point, the particles return to a steady state (Bottom). Bright and dark areas on the photos have been digitally inverted for better visibility. (Right) Graph showing the separation of the two particles (scaled by the size of one particle radius) as a function of time; the unfilled boxes represent the data points depicted by the photos in Left. The dashed line is a linear fit to the initial movement of the particles.

