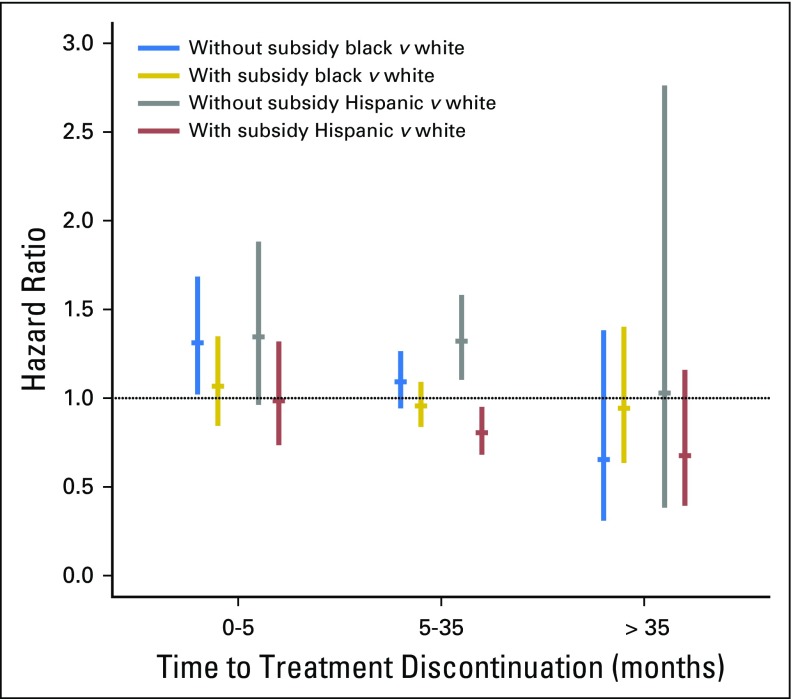
Fig A2.
Discontinuation hazard ratios for black and Hispanic women compared with white women by subsidy status. This disparities in discontinuation, measured as the comparison (hazard ratio) between race or ethnicity groups for women with and without subsidy, are shown. Results are derived from the adjusted model shown in Appendix Table A2. Results with CI crossing 1.0 are consistent with no statistically significant difference in discontinuation by race or ethnicity. Because discontinuation was not proportional by race or ethnicity, results are shown for three time periods (see Methods for further details).

