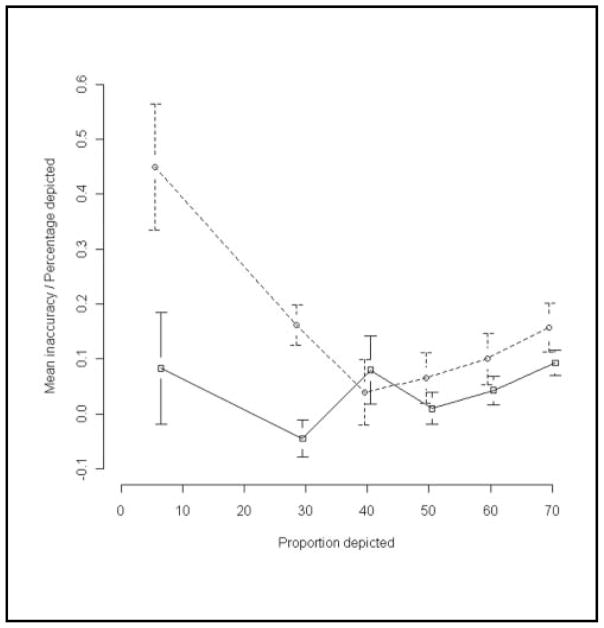
Figure 2.
Relative inaccuracy (inaccuracy as a proportion of the percentage depicted) was higher for random graphics (dotted line) than for sequential graphics (solid line), except at 40%. Differences were statistically significant at 6% and 29%. Error bars depict standard errors, and lines have been slightly jittered to avoid overlap.

