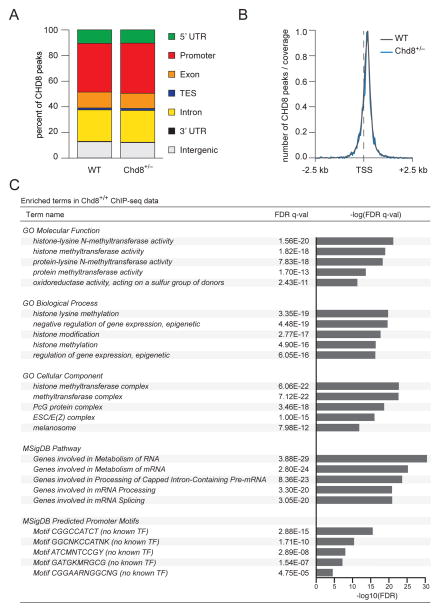
Figure 2. ChIP-seq of adult Chd8+/− cortex shows peak enrichment near transcriptional start sites and in critical cellular pathways.
(A) Bar chart of CHD8 binding peaks as a percentage of total peaks showing CHD8 primarily binds in promoters (WT 38 %; Chd8+/− 39 %) for both genotypes. Replicate somatosensory cortices from wild-type (n = 2) and Chd8+/− mice (n = 2) were microdissected and used for ChIP-seq. ChIP-Seq controls were both input and IgG for each genotype. Peaks were called for each genotype and each control using MACS2 (FDR cutoff of 1%). Only peaks shared between input and IgG for a particular genotype were considered. Annotations were made using HOMER with the mouse mm10 genome assembly and annotation.
(B) Histogram of CHD8 peaks around the transcription start site (TSS). Distance from TSS was calculated using HOMER with the mouse mm10 genome assembly and annotation.
(C) Functional interpretation and gene ontology of CHD8 peaks in Chd8+/+ cortex using GREAT(McLean et al., 2010). Enriched terms for Molecular Function, Biological Process, Cellular Component, MSigDB Pathway, and MSigDB Predicted Promoter Motifs are shown. Also see Figure S3.

