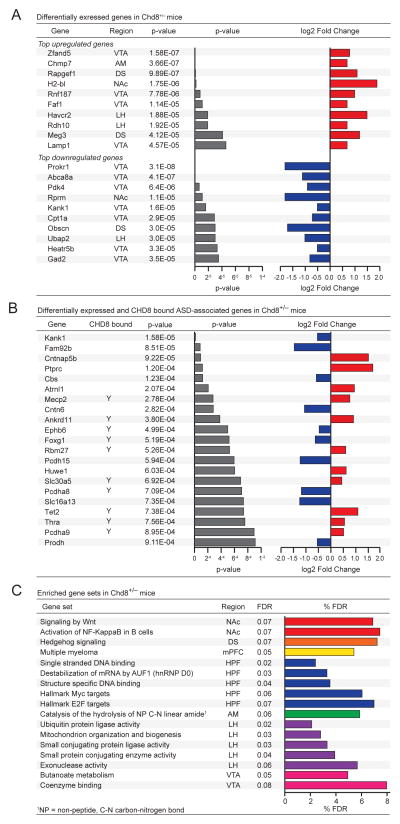
Figure 3. RNA-seq of adult Chd8+/− brain regions shows globally dysregulated genes and pathways.
(A) Table of the top 10 upregulated (top) and downregulated (bottom) differentially expressed genes. Differential expression analysis using DEseq2 was performed on a TPM expression matrix from RNA sequencing libraries generated from different brain regions when comparing 10-week old male Chd8+/− mice and wild-type littermates. Also see Figure S4.
(B) Table of differentially expressed ASD-associated genes in different brain regions when comparing 10-week old male Chd8+/− mice and wild-type littermates. Genes bound by CHD8 are denoted with Y.
(C) Enriched gene sets in Chd8+/− mice. Gene set enrichment analysis was performed on RNA sequencing libraries generated from different brain regions when comparing 10-week old male Chd8+/− mice and wild-type littermates. Table of enriched gene sets with FDR below 8%.

