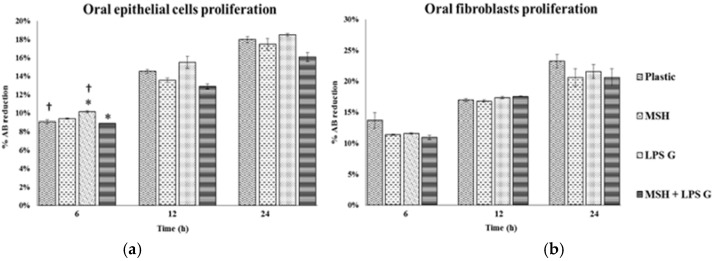
Figure 2.
Human oral epithelial cells (a); and fibroblasts (b) proliferation. Proliferation of human oral epithelial cells and fibroblasts were analyzed after 6, 12 and 24 h on cell cultures (n = 4). These different conditions have been measured by using AlamarBlue test. Data are expressed as mean ± SD. †: difference between non-stimulated and stimulated cells, p < 0.05, *: difference between stimulated cells with or without PGA-α-MSH, p < 0.05.

