Fig. 4.
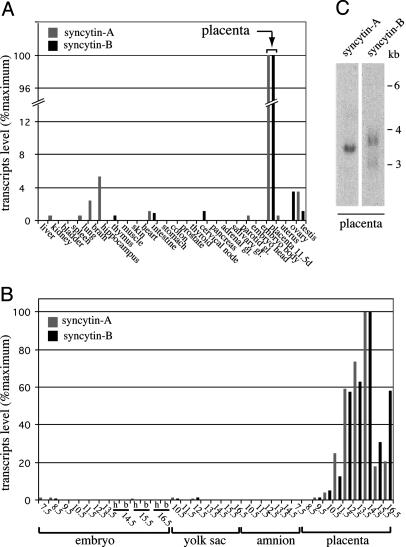
Real-time quantitative RT-PCR and Northern blot analysis of syncytin-A and -B transcripts in mouse tissues. (A and B) syncytin-A (gray bars) and -B (dark bars) transcript levels in tissues of adult male (same results for the corresponding female tissues, when tested, namely thyroid, cervical node, pancreas, adrenal, salivary, and parotid glands; data not shown), adult female (uterus and ovaries), and 11.5-day-pregnant female (embryos and placenta) mice (A), and embryonic tissues (embryo, yolk sac, amnion, and placenta) at different times postcoitum (from day 7.5 to 16.5) (B). The embryo head (h) and body (b) were analyzed separately whenever possible. (C) Northern blot analysis of 11.5 dpc mouse placenta total RNA, probed with a syncytin-A or -B full-length env probe. Exposure time, 4 days.

