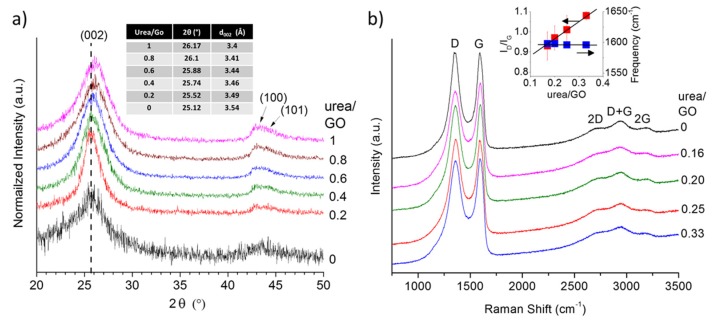
Figure 3.
X-ray diffraction (XRD) pattern showing a shift in the d002 peak toward higher angles as the urea/GO ratio in the precursor increases (a) and Raman spectra (b) of urea/GO-derived samples in comparison to thermally exfoliated graphene. The Raman intensity ratio between D and G band, ID/IG, increases with increasing urea content while the G band position remains nearly unchanged (right insert).

