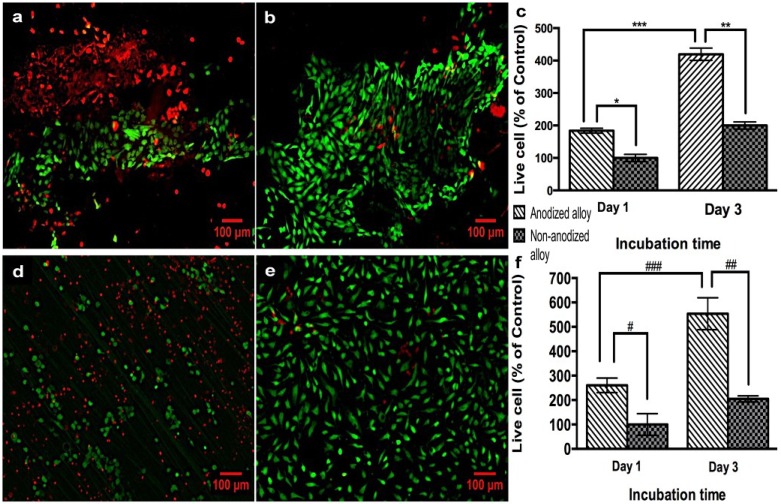
Figure 3.
Live/dead staining of pig periosteal osteoblast (PPO) and pig cartilage chondrocytes (PCC) cells on the samples. (a) PCC cells on non-anodized Ti6Al4V alloy; (b) PCC cells on anodized Ti6Al4V alloy; (c) cell counting of live PCC cells; (d) PPO on the non-anodized Ti6Al4V alloy; (e) PPO on anodized Ti6Al4V alloy; (f) cell counting of live PPO cells. (Values are the mean ± SD, n = 3; * p < 0.05 and # p < 0.05, significantly different from non-anodized Ti6Al4V at Day 1 of cell growth; ** p < 0.05 and ## p < 0.05, significantly different from non-anodized Ti6Al4V at Day 3 of cell growth; *** p < 0.05 and ### p < 0.05, significantly different from anodized Ti6Al4V at Day 3. All the images are the same magnification. The bar is 100 μm).

