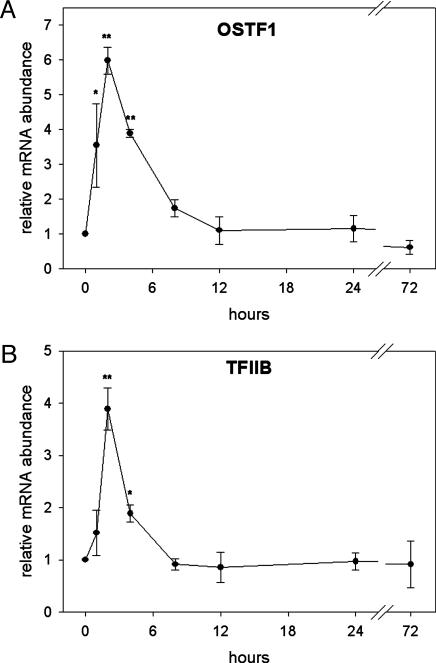
Fig. 2.
Time-course analysis of hyperosmotic induction of OSTF1 and TFIIB mRNA. OSTF1 (A) and TFIIB (B) transcript abundance was analyzed by using quantitative RT-PCR. Experiments were performed with n = 4. Data are given as means ± SEM. *, P < 0.05; **, P < 0.01, compared with control sample (0 h, FW).

