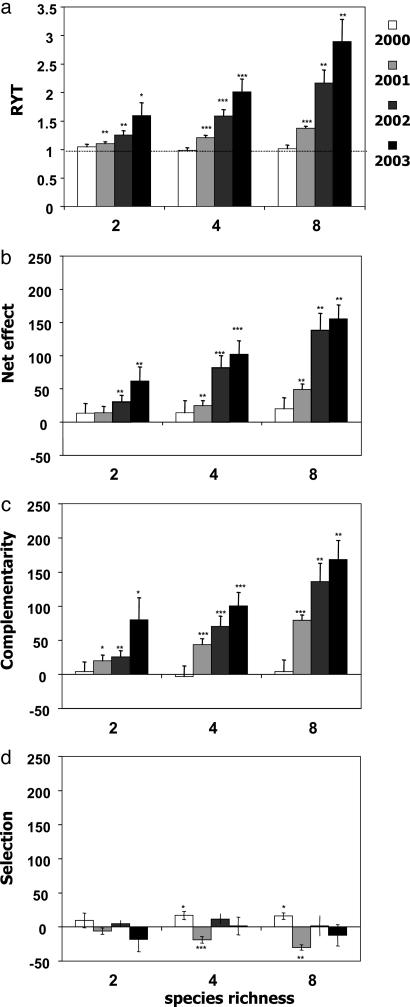
Fig. 2.
Results of different measures of complementarity from 2000 to 2003. (a) RYT increased with species richness in 2001, 2002, and 2003 and increased with time at each level of species richness (P < 0.05). (b) The net effect increased with species richness in 2002 and 2003, and increased with time at each level of species richness (P < 0.05). (c) The complementarity effect increased with species richness in 2001 and 2002, and increased with time at each level of species richness (P < 0.05). (d) The selection effect decreased with species richness in 2001 (P < 0.05). Asterisks indicate significant difference from one (RYT) or zero. ***, P < 0.001; **, P < 0.01; *, P < 0.05. Data show means ± SE.

