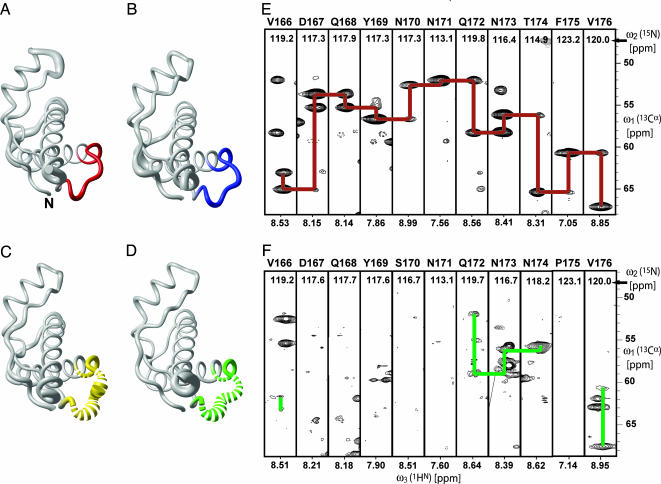
Fig. 2.
Conformation of the loop of residues 166–176 in PrPC from different species and corresponding NMR spectra. (A) Polypeptide backbone of ePrP (121–231) represented by a spline function through the Cα positions. The radius of the gray cylindrical rod is proportional to the mean global backbone displacement per residue, as evaluated after superposition for best fit of the atoms N, Cα, and C′ of the residues 125–228 in the bundle of 20 energy-minimized conformers used to represent the NMR structure (Fig. 1 A). The region comprising residues 166–175 is highlighted in red. (B) Same as A for mPrP[S170N,N174T], with the residues 166–175 in blue. (C) Same as A for mPrP[N174T]. For residues 166–175, the cylindrical rod is yellow; where no backbone resonances could be observed, the cylindrical rod is drawn as a broken line. (D) Same as C for wild-type mPrP, with residues 166–175 in green. (E) 3D HNCA spectrum of ePrP(121–231). Strips are displayed for the residues 166–176, with sequential and intraresidual Cα–Cα connectivities indicated with red lines. The strip containing Phe-175 has been drawn with lower contour levels to show the weak sequential signal. (F) Same presentation as in E for mPrP(121–231), with the observed sequential and intraresidual Cα–Cα connectivities indicated with green lines.

