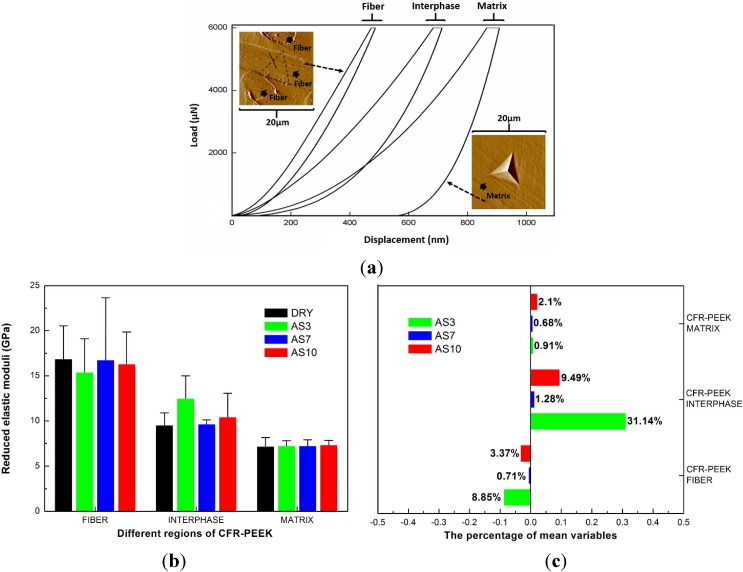
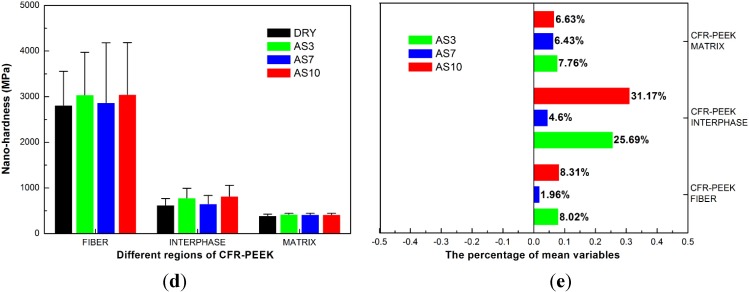
Figure 4.
(a) Schematic of different load-displacement curves represents different regions of CFR-PEEK. The distinct permanent set profile can be seen in the matrix region after a 6000-μN indentation (left SPM figure). When indentation was performed on a carbon fiber, almost no permanent set was observed. The region pointed by the black thin arrow mark is the position where indentation was performed (right SPM figure). (b,c) Reduced elastic moduli (GPa) and percentage of mean variables of different regions of CFR-PEEK. The bars represent standard deviations. (d,e) Nanohardness (MPa) and percentage of mean variables of different regions of CFR-PEEK. The bars represent standard deviations. In the (b) and (d), the negative number on the X axis represents a decrease and positive number represents an increase.


