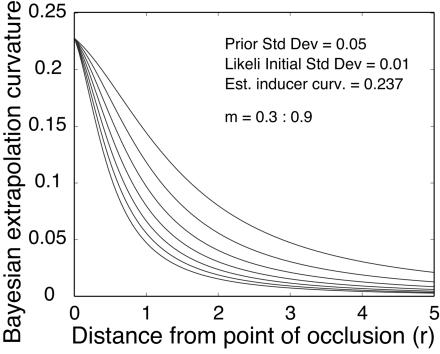
Fig. 5.
Plots showing the variation of curvature along Bayesian extrapolated contours as a function of distance from the point of occlusion. The curvature decreases asymptotically to zero at a rate modulated by the slope term m. This decay is consistent with the pattern of curvature observed along visually extrapolated contours.

