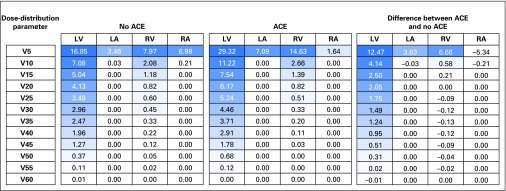
Fig 1.
Comparison of the mean dose distribution parameters of patient cases (patients who experienced an acute coronary event [ACE]) and noncases (those who did not) and calculation of the differences. NOTE. All data are given as the relative volumes (%) of the cardiac substructures that received (x) Gy or more in bins of 5 Gy. LA, left atrium; LV, left ventricle; RA, right atrium; RV, right ventricle.

