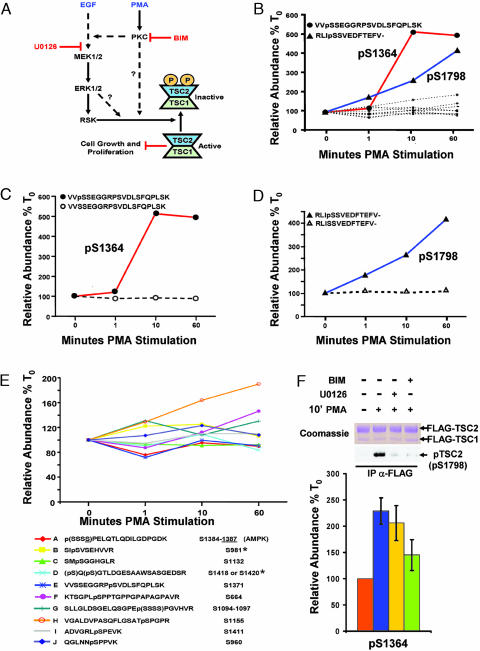
Fig. 6.
Phosphorylation profiling of TSC2 after PMA stimulation. (A) Signaling diagram indicating PKC- and mitogen-activated protein kinase-dependent phosphoregulation of TSC1 and TSC2. Also indicated are the positions in the pathways where indicated pharmacological inhibitors are exerting their effects. (B) Quantification of changes in 12 TSC2 phosphopeptides over the time course of PMA stimulation from one run for each time point. Emphasis is placed on the two phosphopeptides (containing pSer-1364 and pSer-1798, respectively) showing a marked increase after PMA stimulation. (C-D) These phosphopeptides are graphed relative to the corresponding changes in their unphosphorylated counterparts. (E) Further examination of the TSC2 phosphopeptides from B that did not show large changes after PMA stimulation. When the MS/MS spectrum could not distinguish the precise site of phosphorylation, the possible sites allowed by the data were placed in parentheses. AMP-activated protein kinase has been shown to phosphorylate Ser-1387 in vivo, all other sites have not previously been reported, except for those marked with an asterisk, which have been shown to be phosphorylated by Akt in vitro. Human numbering is used for reference. (F) Pharmacological inhibitors define a previously uncharacterized PKC-dependent pathway to TSC2. Labeled and unlabeled cells transfected with FLAG-TSC1 and FLAG-TSC2 were starved and either left unstimulated or stimulated with PMA for 10 min with or without pretreatment for 30 min with the indicated inhibitors. Mixed extracts were immunoprecipitated with anti-FLAG antibodies and subjected to SDS/PAGE and either Coomassie staining for phosphorylation profiling or immunoblotting for TSC2 pSer-1798 with a phosphospecific motif antibody (as defined in ref. 14). Quantification of the tryptic peptide harboring pSer-1798 is shown as the average of three experiments; in two of the experiments, the stimulation was performed on the labeled cells, and, for the other experiment, the stimulation was performed on the unlabeled cells. Error bars denote the standard error of the mean. For the comparison between PMA stimulation with no drug and PMA stimulation with BIM, P = 0.05 for a one-tailed Student's t test.

