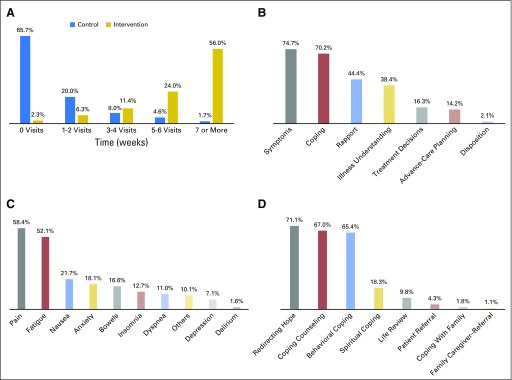
Fig 1.
Frequency and content of palliative care (PC) visits. (A) Number of PC visits by study group. Bars represent the percentage of PC visits for all study patients within 24 weeks. Four intervention patients withdrew from the study before their first scheduled PC visit. (B) Content areas of PC visits with intervention patients per PC clinician documentation. PC clinicians used a standardized template to electronically document the focus of their intervention visits after each encounter. Bars represent the proportion of PC visits that focused on each content area within 24 weeks. (C) Bars represent the proportion of visits that each symptom was addressed when PC noted symptoms as a visit focus. (D) Bars represent the proportion of visits that each topic was addressed when PC noted coping as a visit focus.

