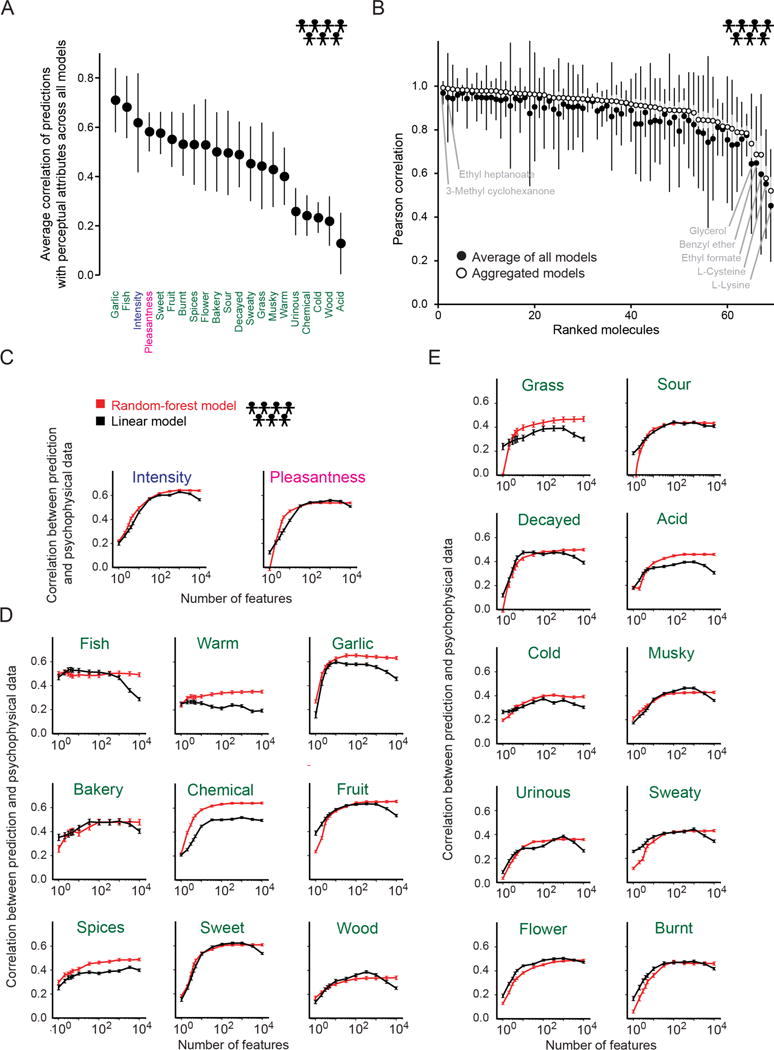
Fig. 3. Predictions of population perception.

(A), Average of correlation of population predictions. Error bars indicate standard deviations calculated across models. (B) Ranked prediction correlation for 69 hidden test set molecules produced by aggregated models (open black circles, standard deviation indicated with grey bars) and the average of all models (solid black dots, standard deviation indicated with black bars). (C–E) Prediction correlation with increasing number of Dragon features using random-forest (red) or linear (black) models. Attributes are ordered from top to bottom and left to right by the number of features required to obtain 80% of the maximum prediction correlation using the random-forest model. Plotted are intensity and pleasantness (C), and attributes that required six or fewer (D) or more than six features (E). The combined training+leaderboard set of 407 molecules was randomly partitioned 250 times to obtain error bars for both types of models.
