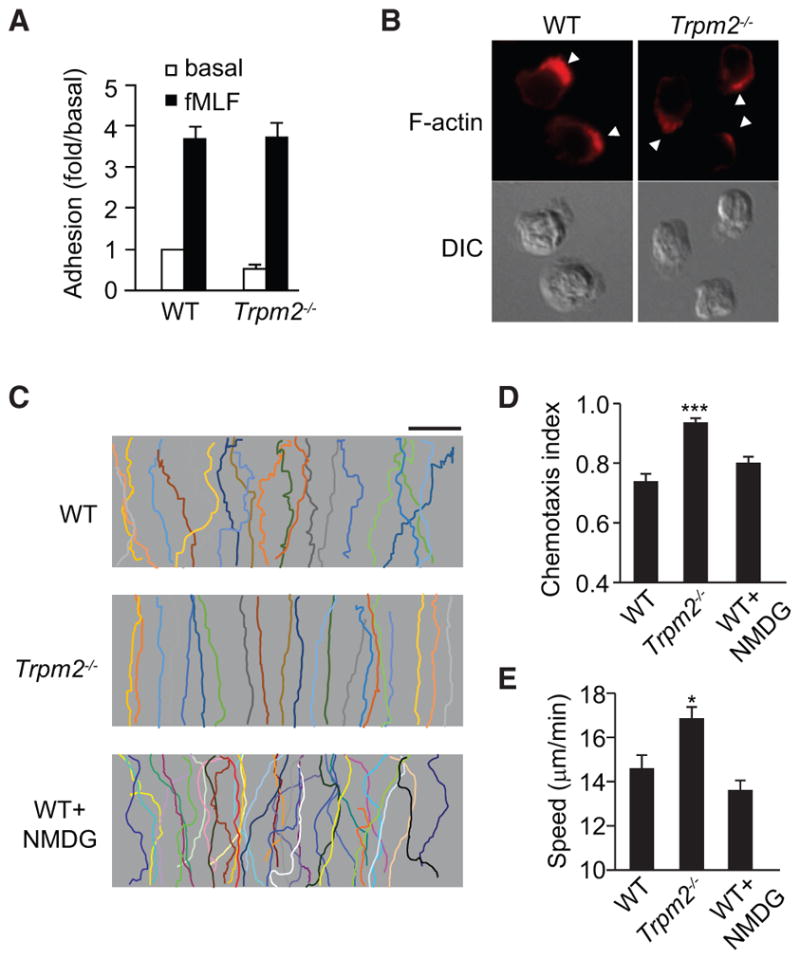
Figure 2. TRPM2 Inhibits Neutrophil Chemotaxis.

(A) Adhesion of WT and Trpm2−/− neutrophils to MLVECs after fMLF stimulation.
(B) Fluorescence microscopy (top row) and differential interference contrast (DIC) images (bottom row) of WT and Trpm2−/− neutrophils (n > 30 per group) stimulated with 100 nM fMLF for 2 min. Arrowheads indicate leading edges.
(C) Trajectories of WT and Trpm2−/− neutrophils or WT neutrophils treated with NMDG (145 mM) in an fMIFL gradient of 100 nM (>30 cells per condition). Each trace represents the trajectory of one cell. Scale bar, 100 μm.
(D and E) CI (D) and migration speed (E) of cells treated as described in (C). *p < 0.05, ***p < 0.01 compared with WT cells (Student’s t test).
Data are representative of (B) and (C) or are from (A), (D), and (E) three independent experiments mean and SEM in (A), (D), and (E).
