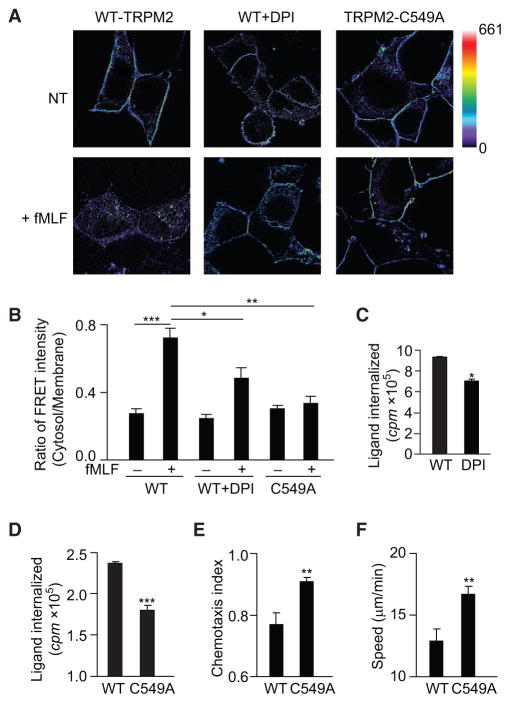
Figure 6. TRPM2 Senses ROS through Oxidation of Cys549.
(A) FRET images of HEK293 cells expressing FPR1-YFP and CFP-TRPM2 in the presence and absence of DPI (10 mM, 30 min) or expressing FPR1-YFP and CFP-TRPM2-C549A before and after treatment with 100 nM fMLF. The scale in the net FRET images was color coded to represent a pixel intensity unit range of 0–661. The images shown are 90 μm2.
(B) The ratio of the mean FRET intensity in the cytosol versus the plasma membrane before and after fMLF, as shown in (A). Mean ± SEM. *p < 0.05, **p < 0.01, ***p < 0.001 (Student’s t test).
(C) Receptor internalization in neutrophils treated with DPI (10 μM, 30 min) and stimulated with 100 nM fMLF is presented as the counts per minute (cpm) of internalized ligand. Mean ± SEM. *p < 0.05 (Student’s t test).
(D) Receptor internalization in WT-TRPM2- or TRPM2-C549A-expressing HL60 cells stimulated with 100 nM fMLF for 20 min is presented as the counts per minute (cpm) of internalized ligand. Mean ± SEM. ***p < 0.001 (Student’s t test).
(E and F) CI (E) and migration speed (F) of WT-TRPM2- or TRPM2-C549A-expressing HL60 cells migrating in an fMLF gradient of 100 nM. Mean ± SEM. **p < 0.01 compared with WT cells (Student’s t test).
Data are representative of three independent experiments (A) or from three experiments (B–F).

