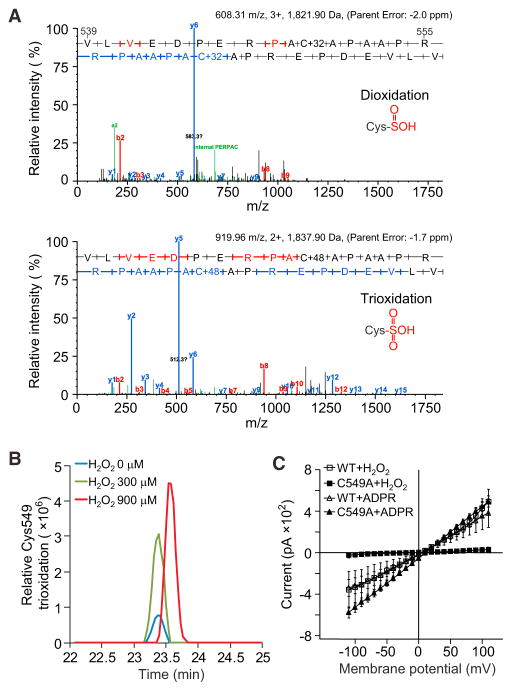
Figure 7. H2O2 Induces Oxidation of TRPM2 Cys549.
(A) Tandem MS (MS/MS) spectra of peptides with Cys549 oxidation. The upper panel is an example of Cys549 di-oxidation, and the lower panel an example of Cys549 tri-oxidation. The peptide sequence is shown (V539–R555). Red and blue bars represent the peptide’s N-terminal (b series) and C-terminal (y series) fragment ions, respectively, within the MS/MS spectrum.
(B) Relative abundance of Cys549 tri-oxidations in samples treated with 0, 300, and 900 μM H2O2. The area of each peak denotes the peptide intensity in the MS.
(C) Whole-cell currents induced by H2O2 or ADPR were recorded in HL60 cells transfected with WT-TRPM2 or TRPM2-C594A using the patch-clamp technique. H2O2 was added to the bath solution (300 μM) and ADPR was added to the pipette solution (500 μM). Mean ± SEM.
Data are representative of (A) and (B) or are from three independent experiments (C).

