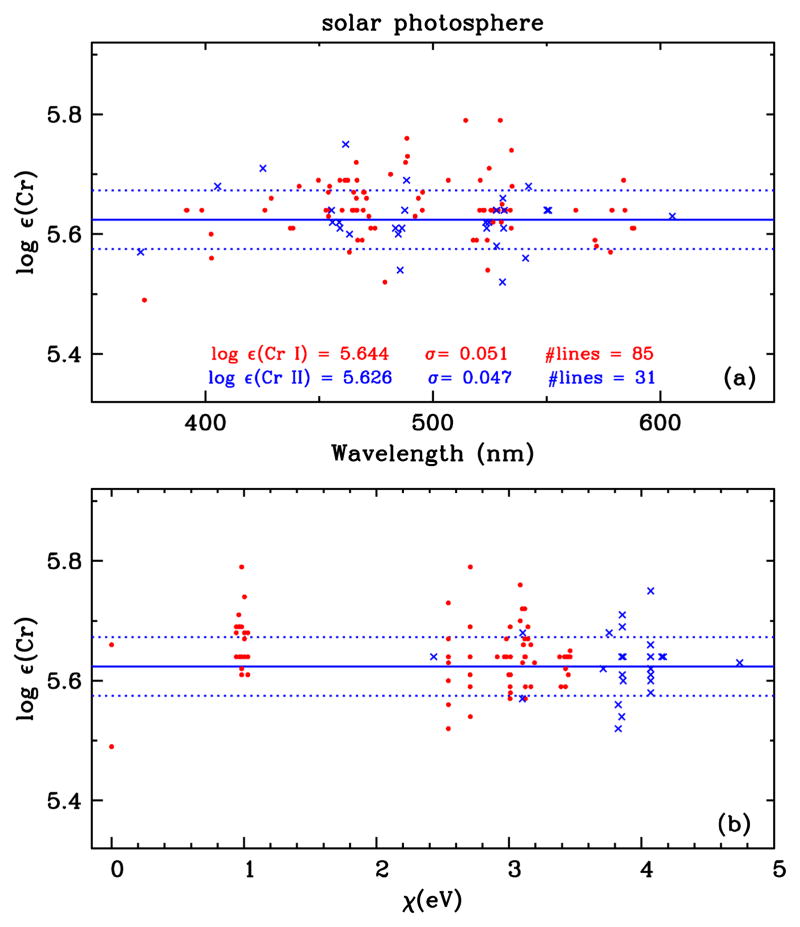
Figure 3.
Solar photospheric abundances for Cr I and Cr II lines plotted as functions of wavelength (panel (a)) and excitation potential (panel (b)). The statistics for the mean abundances for Cr I (red dots) and Cr II (blue x’s) are written in panel (a). In each panel blue solid lines indicate the mean Cr II abundance, and blue dotted lines indicate ±σ deviations from the mean.

