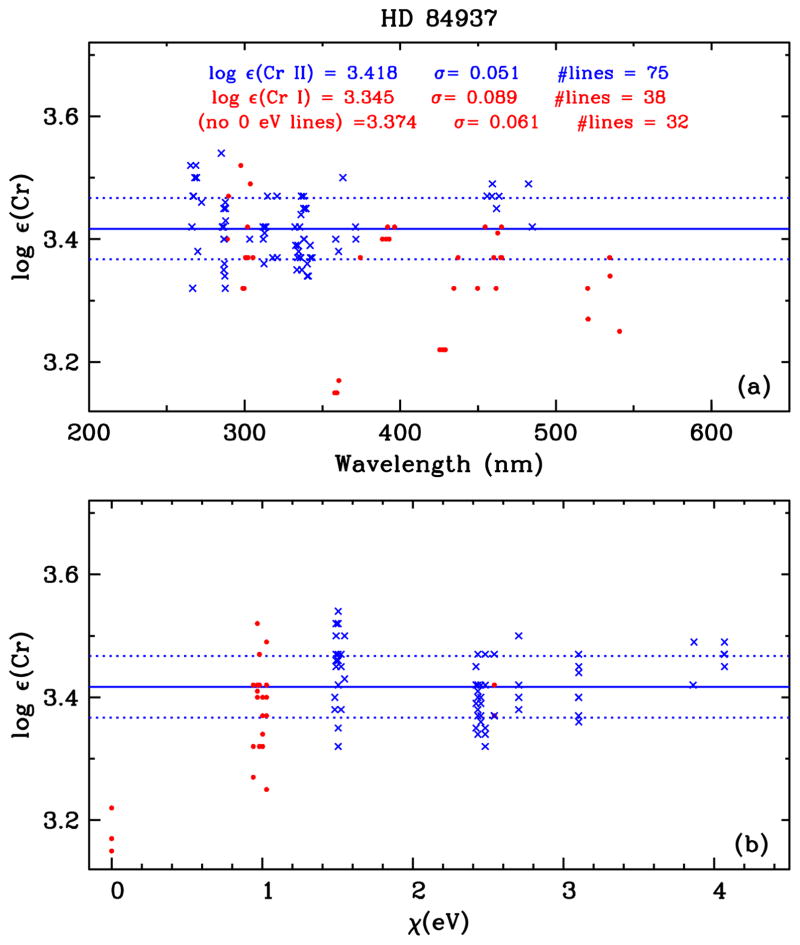
Figure 4.
HD 84937 abundances for Cr I and Cr II lines plotted as functions of wavelength (panel (a)) and excitation potential (panel (b)). The definitions of points and lines in this figure are the same as in Figure 3. The statistics for the HD 84937 mean abundances are written in the top panel, and we show the Cr I mean with and without inclusion of the six E.P. = 0 eV transitions, which clearly yield very low abundances.

