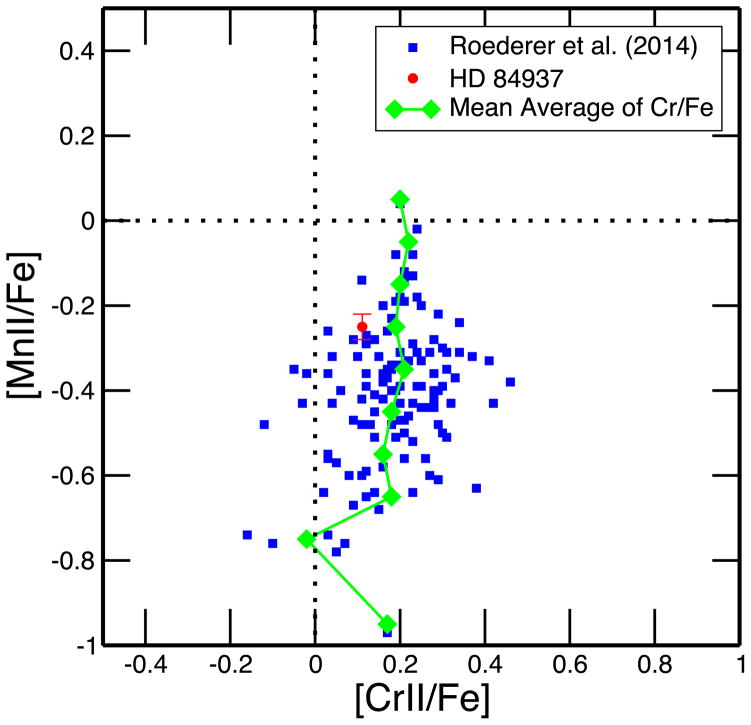
Figure 7.
Abundance ratios Mn/Fe vs. Cr/Fe for the ionized transitions of each element. The filled circle for HD 84937 is the ratio of the mean Cr derived in this paper with the mean Mn from S16. The green filled diamonds represent average values of [Cr/Fe] within vertical bins of 0.1 in [Mn/Fe], with solid lines connecting the averages. The other symbols and lines are as in Figure 5.

