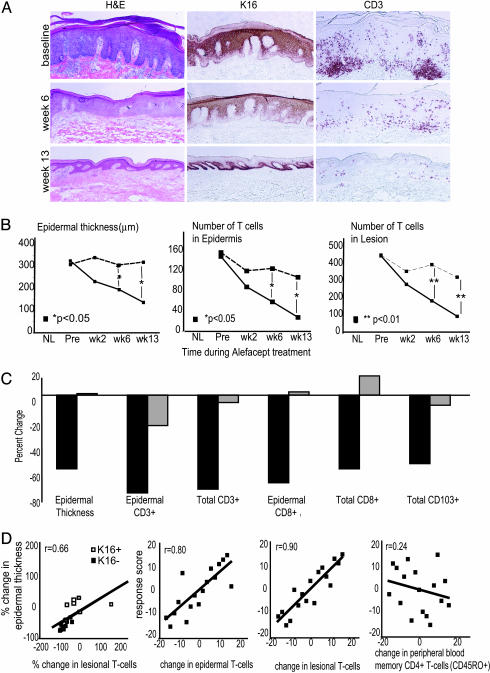
Fig. 1.
Routine histology and immunohistochemical analysis of skin biopsies before and during treatment with alefacept. (A) Example of one patient (a responder) showing routine hematoxylin/eosin stain with normalization of epidermal thickness and K16 staining with treatment, and corresponding reductions in CD3+ cells in the epidermis and dermis. (Magnifications: ×10.) (B) Mean values of epidermal thickness (μm), epidermal T cell (CD3+) number, and total (epidermal and dermal) T cell (CD3+) number per low-power field during treatment, with patients classified by response (see text) (solid line, responders; dashed line, nonresponders). *, P < 0.05; **, P < 0.01. (C) Percent decrease at week 13 compared with baseline in responders (black bars) and nonresponders (gray bars) for epidermal thickness, epidermal CD3+, total CD3+, epidermal CD8+, total CD8+, and total CD103+ cells. (D) Correlation plots with linear regression comparing changes in epidermal thickness and lesional T cells; response score and change in epidermal CD3+, lesional CD3+, and peripheral blood memory (CD45RO+) CD4+ T cells.

