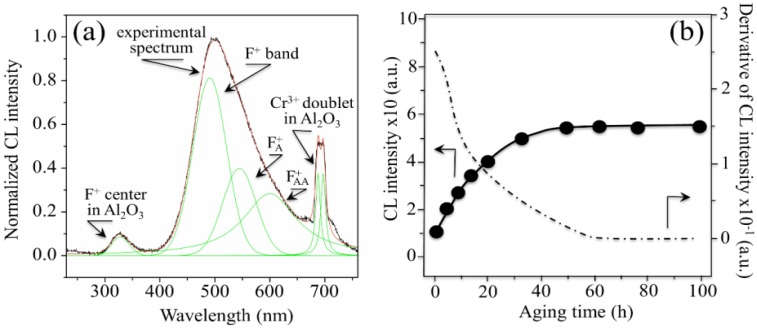
Figure 3.
(a) Typical CL spectrum of biomedical 3Y-TZP. Three distinct emissions from oxygen-related defects with different structures overlap in the CL spectrum of ZrO2, namely the bands referred to F+, FA+, and FAA+ centers. Two extrinsic CL emissions also arise from the presence of Al2O3 dopant in biomedical 3Y-TZP; (b) evolution of CL intensity (or oxygen-vacancy annihilation) upon exposure time in hydrothermal environment of biomedical 3Y-TZP in an autoclave operating at 121 °C under 2 bar pressure of water vapor. The size of the used symbols corresponds to the standard deviation of the measured CL intensity. The derivative of the curve is also shown, which represents the vacancy annihilation rate on the surface.

