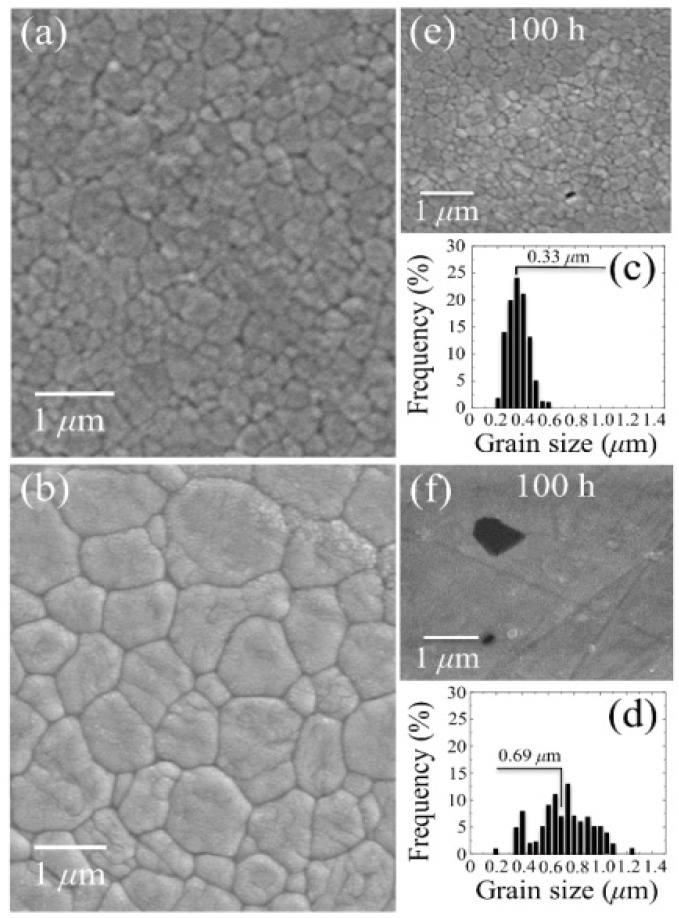
Figure 8.
Scanning electron micrographs are shown in (a) and (b) of the as-received (thermally etched) microstructures of 3Y-TZP Samples A and B, respectively; The respective histograms of grain size are shown in (c) and (d) (average grain-size values given in inset); In (e) and (f), surfaces (without thermal etching) after 100 h exposure to hydrothermal environment are given for Samples A and B, respectively.

