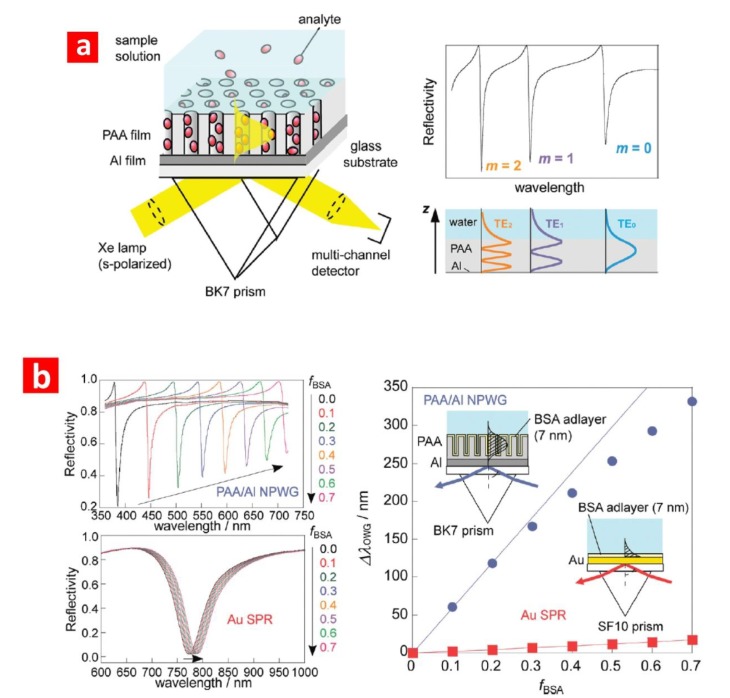
Figure 5.
(a) Schematic illustration of the SPR-NAA sensor developed by Hotta et al. and the typical reflection spectrum of this system with the electric field distributions of the TE waveguide modes with different mode orders (m) (adapted from [45]); (b) changes in reflection spectra simulated by the Fresnel calculations depending on the surface coverage of BSA molecules (fBSA) (adapted from [45]). TE, transverse electric; PAA, porous anodic alumina; NPWG, nanoporous optical waveguide.

