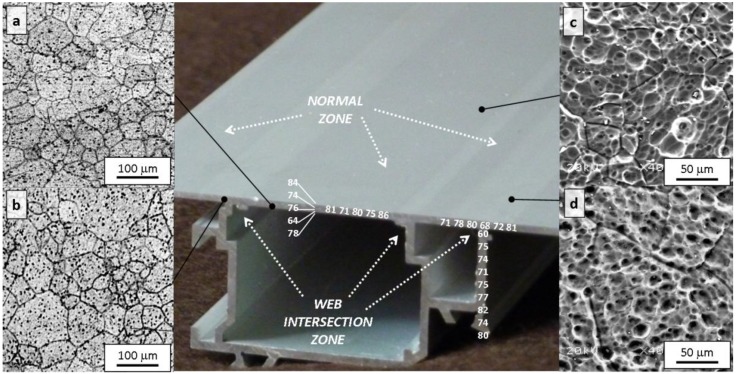
Figure 7.
The photograph in the center shows the outer seen part of the anodized profile flange. It depicts the presence of bright streaks alternating with dull bands. Vickers microhardness values corresponding to the cross section are also indicated (white lettering). Upper and lower LOM micrographs to the left of central picture correspond to the cross section according to: (a) normal zone (N) and (b) web intersection zone (WI). Upper and lower SEM micrographs to the right of the central photograph correspond to the profile flange surface, according to; (c) normal zone (N); and (d) web intersection zone (WI).

