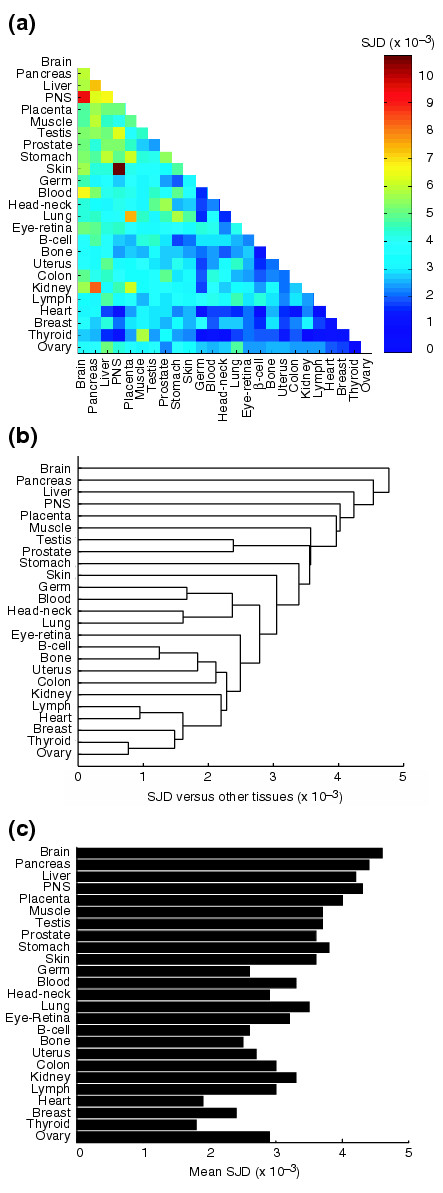
Figure 5.

Comparison of alternative mRNA isoforms across 25 human tissues. (a) Color-coded representation of SJD values between pairs of tissues (see Figure 4 and Materials and methods for definition of SJD). (b) Hierarchical clustering of SJD values using average-linkage clustering. Groups of tissues in clusters with short branch lengths (for example, thyroid/ovary, B-cell/bone) have highly similar patterns of AS. (c) Mean SJD values (versus other 24 tissues) for each tissue.
