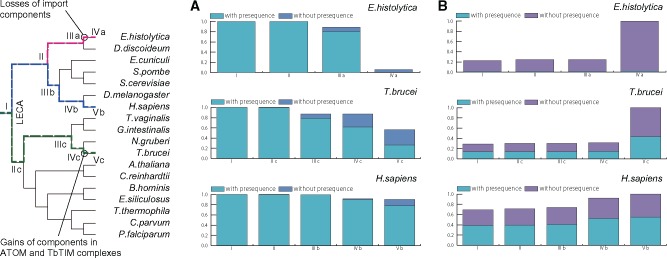
Fig. 6.
Gains and losses of orthogroups and their presequences in representative organisms. The Y-axis shows the fraction of ortholog states (absence, existence without presequence, and existence with presequence). The X-axis shows evolutionary stages, which are represented in the schematic tree. (A) Losses of estimated 245 primitive presequence-containing orthogroups. Bars show fractions of estimated ancestral states of 245 orthogroups at each stage. (B) Gains in mitochondrial or mitosomal proteomes. Fractions of genes with and without predicted presequences are shown in bars. Presequence prediction was performed by MitoFates (Fukasawa et al. 2015). Genes gained during stage I are primitive genes; genes gained after stage IV or V are more lineage-specific.

