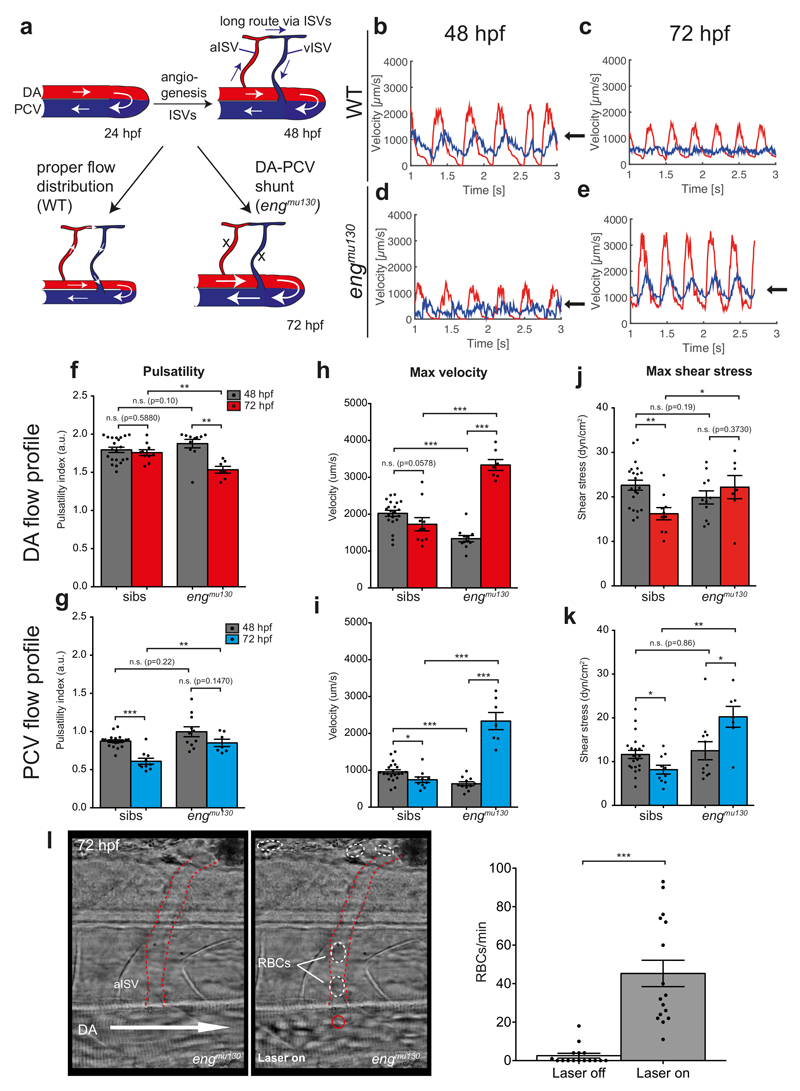
Figure 4. Blood flow patterns adapt to the expansion of the embryonic vasculature.
(a) Cartoon depicting blood flow changes through axial vasculature during development. At 24 hpf, all blood flow is through a primary arterial-venous loop. The addition of new capillaries through angiogenesis creates longer loops that are perfused with RBCs in WT, but not in engmu130 mutants. (b-e) Representative DA (red) and PCV (blue) blood flow profiles for sibling and engmu130 mutant embryos at 48 hpf and 72 hpf. Arrows indicate PCV velocity peaks following arterial velocity peaks. (f-k) Quantification of DA and PCV blood flow parameters (pulsatility, maximum velocity and maximum shear stress) in siblings and engmu130 mutants between 48 hpf and 72 hpf (48 hpf n=21 siblings, n=11 mut; 72 hpf n=10 siblings, n=7 mut). Analysed by Mann-Whitney U test. (l) Still images from movie showing diversion of RBCs into aISV by application of holographic optical tweezers (HOT). Arrow indicates direction of DA blood flow. aISV outlined by dashed red lines. Red circle denotes HOT laser focal point near aISV entrance. Dashed white circles highlight RBCs in lumen of aISV. Quantifcation of RBC flow through the same ISVs with HOT inactive (laser off) or active (laser on) (n=16 aISVs). Analysed by Mann-Whitney U test.
n.s., not significant, *P<0.05, **P<0.01, ***P<0.001, error bars indicate s.e.m.

