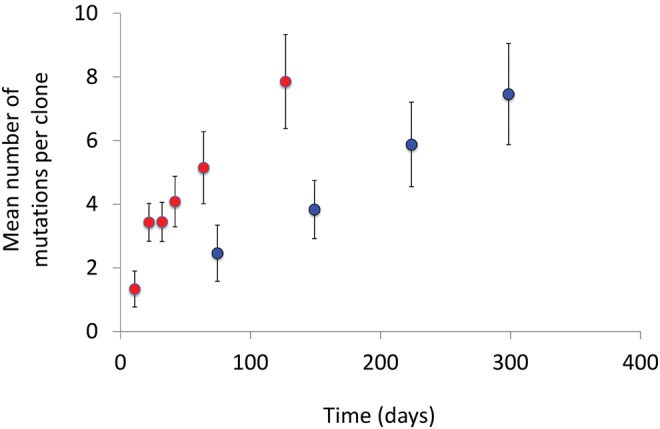
Fig. 3.

Mean number of mutations per clone increases with time spent under LTSP. Depicted is the average number of mutations observed per nonmutator LTSP clone across all sampled populations (Red dots). For comparison sake we also depict the number of mutations accumulated as a function of time within clones sequenced from Richard Lenski’s long-term serial dilution evolutionary experiment (Tenaillon et al., 2016, blue dots). Error bars represent the standard deviation across clones.
