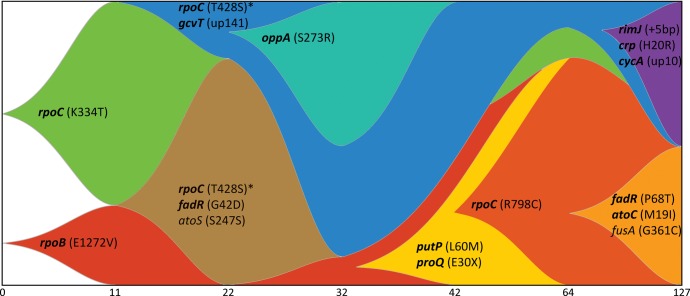
Fig. 6.
Clear pattern of clonal interference observed within LTSP populations. Presented is a Muller diagram depicting the relative frequencies of different haplotypes segregating within LTSP population 1. The X-axis indicates the sampling times (not to scale). Only mutations appearing in 30% or more of population 1 clones, in at least one time point, were used to generate the plot. Gene names appearing in bold represent genes that are mutated in at least three of the five LTSP populations. Similar patterns of clonal interference were observed for the other four populations as well (supplementary figs. S5–S8, Supplementary Material online). *The mutation in rpoC is identical in both drawn lineages. There is no way to tell with complete certainty whether this mutation occurred within this population once or twice independently. up = upstream.

